What Informatica Taught Me Before Synapse and Microsoft Fabric
For much of my time working on enterprise data integration, Informatica was the familiar environment. The work revolved around sources, transformations, mappings, workflows, and getting dependable data into a warehouse. Toward the end of my time in higher education, I was also working with Azure Synapse and Microsoft Fabric.
Looking back, the change in tools was substantial. The change in the questions I had to answer was smaller than I expected.
Where does this field come from? What does one output row represent? Which rule should win when sources disagree? Can we repeat the load without changing the answer? How do we know when a downstream report is safe to trust?
Those questions followed me across visual data flows, SQL, notebooks, and cloud storage. Azure Data Factory, Synapse, and Fabric all have visual tooling; the important distinction is what each interface makes easy to inspect.
What visual mappings made obvious
What I miss most is field-level traceability. In an Informatica mapping, I could follow an individual source field through the connected transformations, inspect the expression applied at each step, and see which target field received the result. The lineage was visual and specific. It wasn’t only a line from a source table to a destination table. It was a path I could investigate one field at a time.
Take a made-up example: a source has amount_text, an expression normalizes it, another step converts it to a decimal, and the target receives amount. In a visual mapping, I want to click amount and work backward through those exact ports and expressions. In a SQL notebook, the equivalent logic may be split between a CTE, a helper view, and a Python function. I can still trace it, but I’m now doing more of the navigation myself.
That did not make mappings automatically readable. A complicated mapping can be a jungle of connected transformations, and reusable components can hide details. Visual wiring also doesn’t explain why a business rule exists. But the ability to inspect a field’s journey without reconstructing the whole code path was genuinely useful.
Informatica’s PowerCenter documentation describes separate tools for defining sources and targets, designing transformations and mappings, and managing workflows. That distinction between what transforms the data and what runs the transformation remains valuable regardless of product.
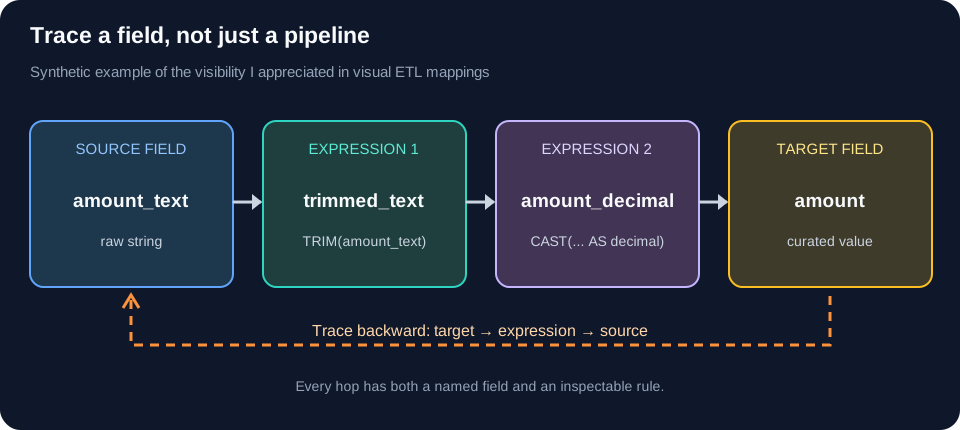
This is the level of traceability I miss: field, expression, next field—not merely the order of pipeline activities.
The wizards saved real work
The other thing I don’t want to understate is how quickly Informatica let us build conventional ETL jobs. For a structured source and a familiar warehouse target, the mapping tools and wizards removed a lot of repetitive setup. You could spend your attention on the data rules instead of writing every operation from scratch.
Even a slowly changing dimension Type 2 flow—where a changed business attribute should create a new version while retaining the previous one—had a guided starting point. That doesn’t make SCD Type 2 trivial. You still have to choose business keys, compare attributes correctly, handle late changes, and decide effective-date semantics. But the wizard could generate much of the scaffolding and leave you with something visible to inspect. Informatica documents that Type 2 wizard.
I sometimes miss that speed. A few lines of SQL may look shorter than a mapping, but assembling the validation, change detection, historical updates, and operational checks by hand is still work.
Synapse changed where I expected the boundary to be
With Synapse, orchestration and data transformation could be composed in different ways. A pipeline could move data, invoke a data flow, or coordinate code running elsewhere. Azure Data Factory and Synapse have visual pipelines and mapping data flows; Microsoft Fabric also offers visual pipelines and Dataflow Gen2. This was never a clean transition from “visual” to “code.” The Synapse data-flow model is one example.
The shift for me was that the execution boundary became a more deliberate design choice. Do we express a transformation as SQL close to the warehouse? Use a visual data flow? Run notebook code? Persist an intermediate result or keep it temporary? Which choice makes reruns and validation easier?
Those decisions are not unique to cloud computing. Informatica has long supported database pushdown and reusable transformations. But as more engines became available under one analytical workflow, choosing the engine started to feel like part of the architecture rather than simply a feature of the ETL tool.
What the newer ecosystem gave back
The flexibility was real. We were no longer thinking only in terms of structured rows moving between known schemas. Files, semi-structured records, and unstructured inputs could live alongside relational tables. Python and Spark libraries opened up transformations that would have been awkward to express in a traditional mapping. Changing source schemas could be handled through explicit schema inference, validation, or controlled evolution instead of treating every new column as an entirely new interface.
None of this means Informatica was incapable of handling unusual data. The difference was the range of tools and storage models available to us, and how easily we could reach outside a dedicated ETL environment. Fabric’s Lakehouse combines file storage and Delta tables, and Delta schema evolution offers options for evolving tables. Those options are useful only with a clear policy: accepting every schema change automatically can be as dangerous as rejecting all of them.
So I see a genuine trade: Informatica could make the standard path quick and inspectable; modern platforms make the nonstandard path much less constrained, while asking engineers to assemble more of the discipline themselves.
Fabric made the storage boundary harder to ignore
Fabric brought another useful distinction into view: a Lakehouse and a Warehouse may be part of one analytical platform, but they are not interchangeable execution environments. A Spark notebook operating on Delta files and a Warehouse operation using T-SQL have different write paths and failure boundaries.
That matters for a workflow that appears to have one simple objective: transform source records into curated data. Once publication spans independently committed steps, a green orchestration run is not a complete recovery model. You need to know what was committed, what can be replayed, and what should be reversed.
I’ve written separately about why a data pipeline is also a state machine and why backout is harder than loading. Those ideas grew more important as the number of execution and storage choices grew.
Code gave me freedom; it also moved the documentation burden
A SQL or PySpark notebook makes complex logic easy to express without forcing it through a palette of transformations. Code-first approaches such as typical Databricks notebook development and dbt models lean more heavily on reading and navigating code, even where their platforms offer graphical orchestration or lineage views. You can test small functions, version code alongside other project files, and use libraries that weren’t designed specifically for ETL.
But the field-to-field map doesn’t necessarily come for free in those code-first paths. Visual pipelines in ADF, Synapse, or Fabric are not automatically equivalent to Informatica’s connected, port-by-port mapping and expression inspection, either. Someone has to decide how to make column lineage, expressions, source contracts, lookup dependencies, intermediate stages, and publication semantics discoverable. Comments help. Named SQL views help. Tests help more. A hundred-line notebook can still leave the next engineer guessing about its intended grain.
This is partly why I keep returning to the idea of generating data pipelines from explicit contracts. A visual editor is useful when it exposes meaning. It is less useful when it merely draws attractive boxes around logic nobody has defined.
What I would carry forward
If I were choosing the shape of an ETL system today, I would borrow from both generations:
- From Informatica’s mapping experience: port-level source-to-target lineage, inspectable expressions, reusable mappings, and wizards for common warehouse patterns.
- From ADF, Synapse, and Fabric’s visual tooling: accessible pipeline orchestration and low-code data flows, alongside the option to use SQL or notebooks when appropriate.
- From code-first workflows such as Databricks notebooks and dbt models: expressive transformation logic, reproducible tests, ordinary code review, and the ability to use suitable engines. The broader modern ecosystem also makes unstructured and evolving inputs more approachable.
- From hard production lessons: durable input identity, reconciliation at meaningful boundaries, traceable decisions, and recovery defined before the first retry.
There is no point recreating Informatica’s interface in a notebook, or drawing a giant graph merely because the old tool did. Equally, there is no virtue in replacing a readable mapping with six disconnected scripts and calling the result modernization.
The best part of moving between these platforms was realizing that I could keep the discipline without keeping the exact tooling. The user-facing technology changes. The responsibility to explain what the data means, and why the next run will behave, stays with us.
More on Data engineering When Backout Is Harder Than Loading →